Coverage Stories
Coverage Stories give your team a plain-English account of everything Pie found this week, updated as each PR merges. No test logs, no digging through run history. A clear picture of what shipped and what product bugs were found.
Who Coverage Stories Are For
Developers: When a loop finds something your PR broke, you’ll get a notification linking you straight to Coverage Stories. You’ll see what broke, which flow was affected, and a fix suggestion already waiting in the issue panel. You never need to open a test log.
Engineering leads: You want a quality signal across the team, not a list of individual test verdicts. Open Coverage Stories once a week, read the narrative, scan the issue cards. That’s the full picture.
Anatomy of a Coverage Story
Each story covers one week and contains:
The narrative
A plain-English summary of the week: how many PRs your team merged, how many test flows ran, and how many product bugs were found.
“Your team shipped 7 PRs this week. Pie tested 120 flows across 5 suites. 2 issues found.”
PRs tested
Every pull request within this story’s window, linked directly to GitHub.
Issue cards
One card per product bug found. Each card shows what broke in plain English, the severity (critical, high, medium, or low), and which PR introduced it if traceable.
All-clear weeks
If a loop run finds no issues, the story shows an all-clear. These clean weeks sit alongside issue weeks so you get a truthful picture over time, not just an alert feed.
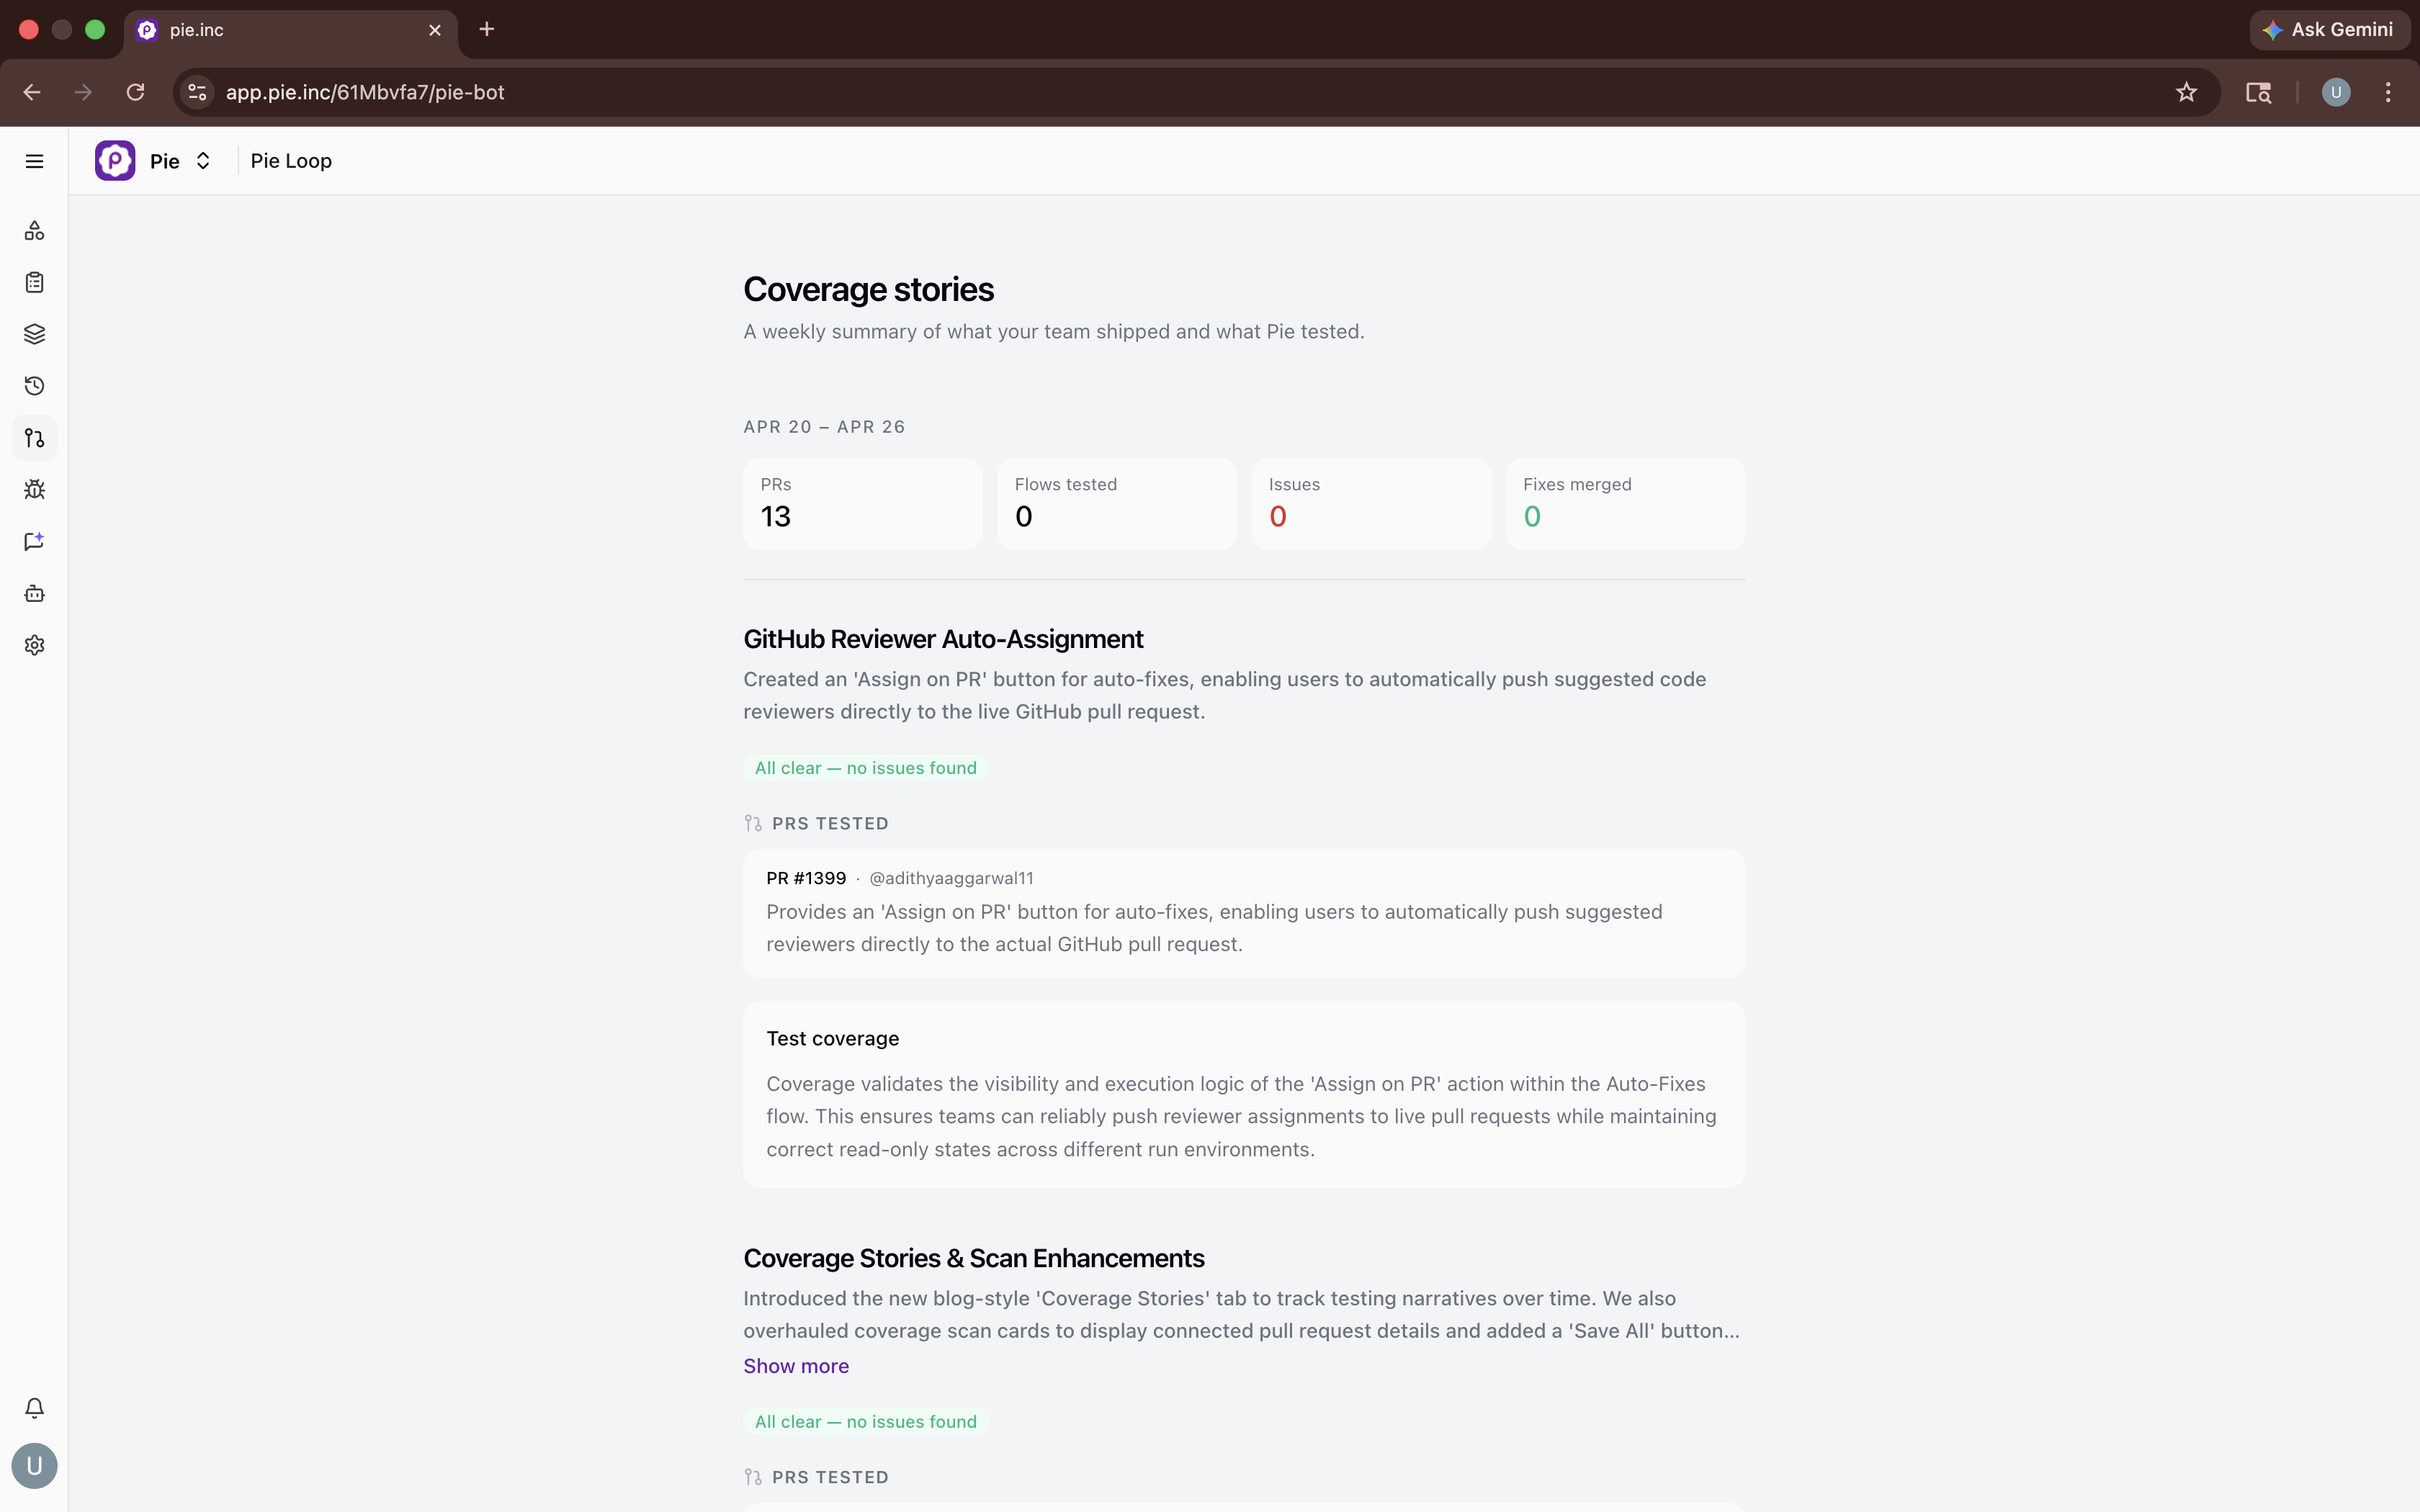 Coverage Stories. A weekly view of every PR your team shipped and what Pie found.
Issue Cards
Click any issue card to open the detail panel:
- Expected vs. Observed: What Pie was testing and what the app actually did
- Code changes: The diff from the PR that introduced the issue
- Screenshots: Before/after visual evidence of the bug and the fix suggestion
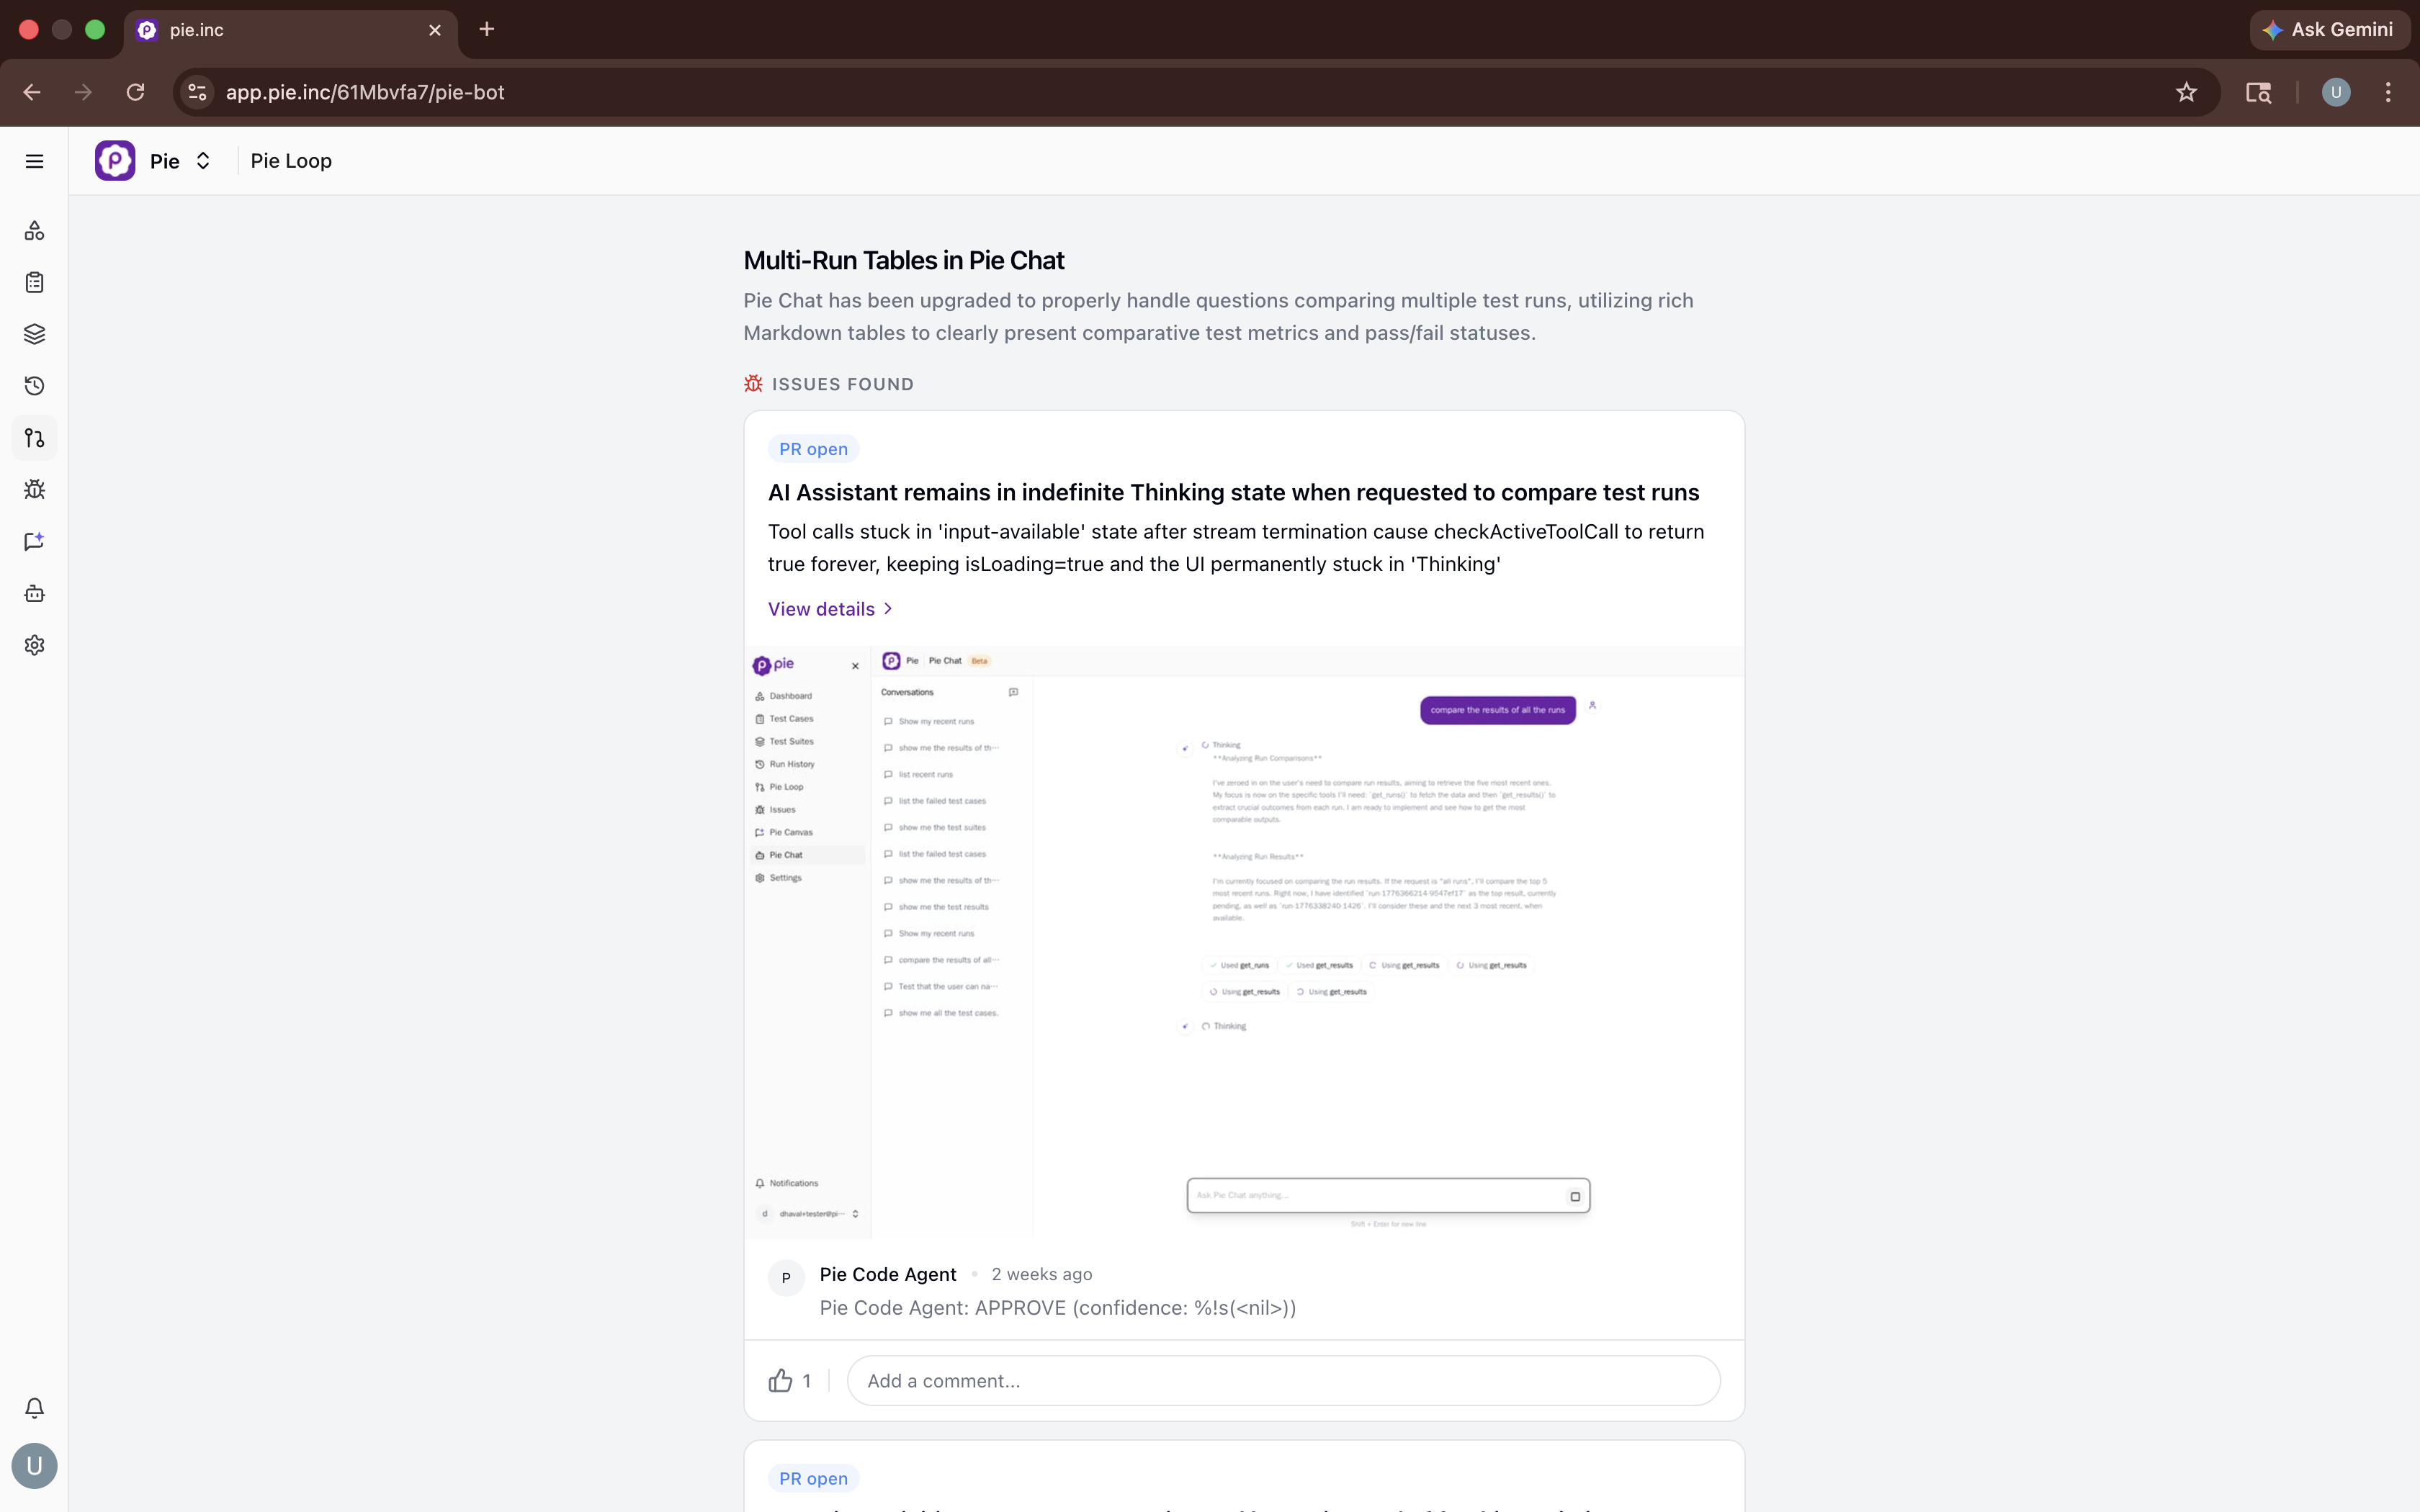 Issues Found. Each issue surfaces inside the weekly story, under the PR that introduced it.
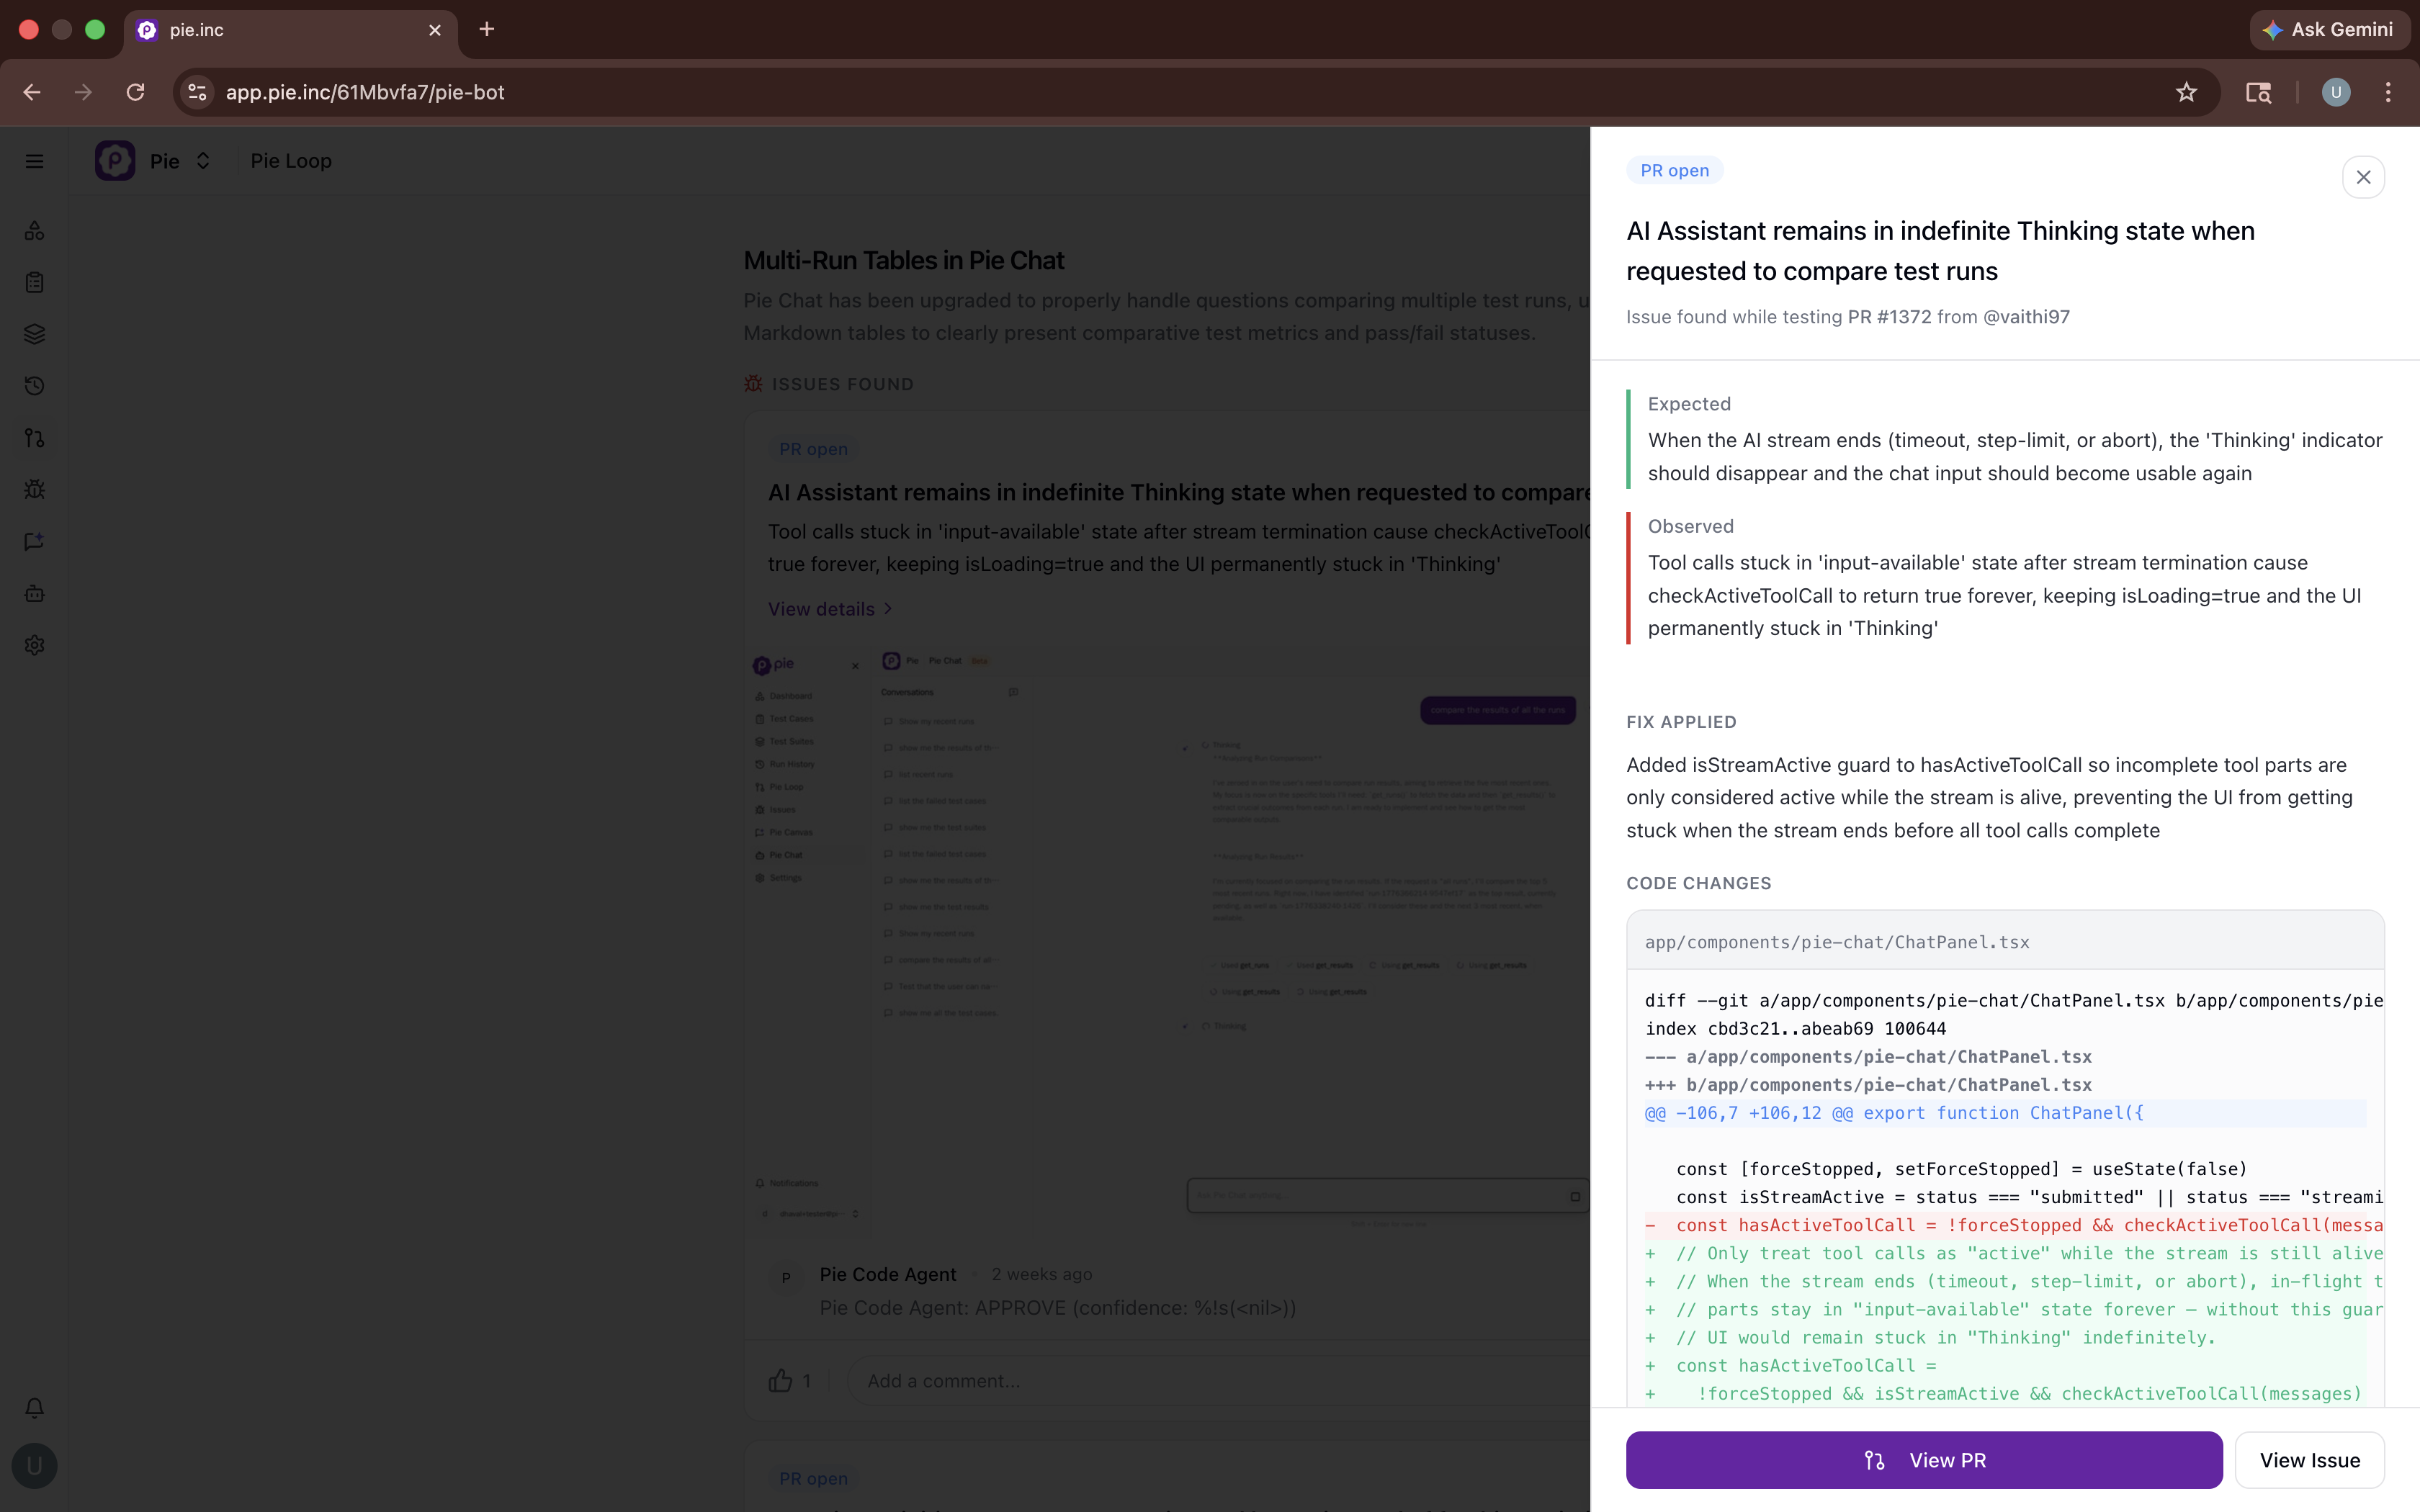 Issue detail. Full context on what broke, why, and the suggested fix.
When Pie finds a bug it can fix, a suggested fix appears in the issue detail panel, with the code change, before/after screenshots, and a plain-English explanation. The issue stays open until it is resolved or dismissed.
Fix Status
Each issue card shows the current status:
| Status | What It Means |
|---|---|
| Fix ready | A suggested fix is available in the issue detail panel |
| Fix merged | The fix was applied and the issue is resolved |
| Generating fix | Pie is writing the fix, typically ready within a few minutes |
| Dismissed | The issue was dismissed and will not be tracked further |
Week-Over-Week Accumulation
Pie uses the week as the story seed. Each loop run within a week updates the same story rather than creating a new one, so by Friday the story reflects everything that ran all week.
Looking back over months of stories, you can track which weeks had regressions and which were clean, whether your issue rate is trending up or down as your team ships faster, and which features or PRs have historically introduced the most regressions.
Going Deeper
Coverage Stories show outcomes. When an engineer needs to understand exactly what happened, click into any issue card for the full detail: expected vs. observed, the code diff from the PR that introduced it, and step-by-step screenshots at the point of failure.
Developers following up on a notification and engineering leads doing a weekly check never need to go further than the issue card.
Related Features
- Connect Pie Bot: Set up the GitHub integration that powers Coverage Stories.
- Issues & Findings: Understand how Pie surfaces and prioritizes the bugs it finds.
Need Help?
- Support: support@pie.inc